Digging Into the JVM Memory
Digging Into the JVM Memory
Yesterday the production instance of NiFi failed. There were a number of potential issues so the root cause was hard to determine at a glance. The JVM heap was pretty much exhausted and I thought it might be a memory leak but also checked system resources as that is faster. There was a large spark job that was being run on the node, which initially looked like it could be related but didn’t really explain the heap exhaustion. We asked the user to stop this job but, as expected, there was no change with NiFi. I couldn’t even see the UI to begin debugging from there so restarted. This helped initially but of course the memory jumped again. So I started debugging the memory to see what was going on.
JMap and MAT
Initially I reached for JMap and Eclipse Memory Analyser as I had used previously. This was not an ideal solution. Jmap took ages to take the snapshot to the memory and was huge when it finally finished (~ 7GB) so took an age to actually get to my local machine for analysis. When I managed to get it downloaded it couldn’t even be opened!
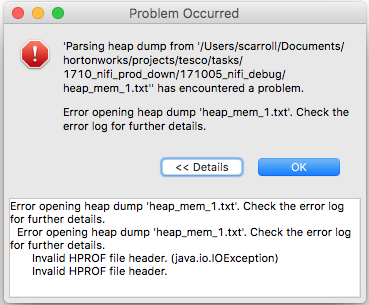
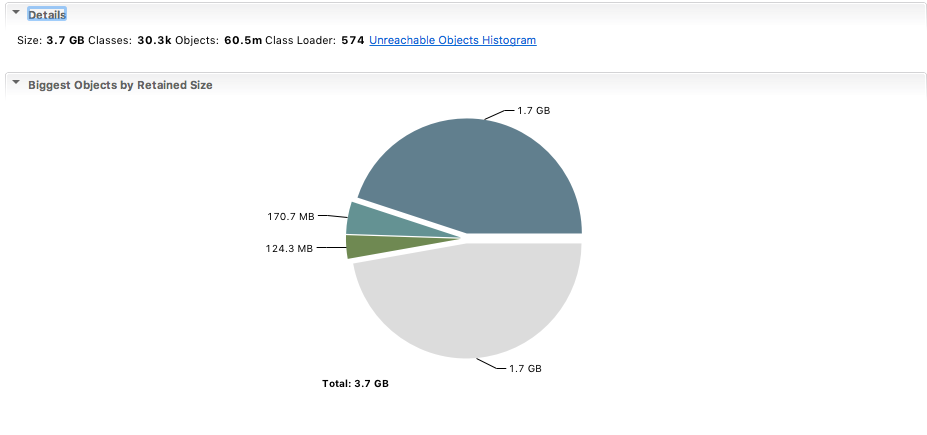
StackOverflow to the rescue! Apparently, MAT can’t open anything other than binary format. So I took another dump (this time binary), waited for it to download again and import. Ironically that failed due to insufficient memory aad to work out how to configure MAT’s settings. Finally, I managed to get it working but couldn’t read what it was telling me. It looked like it was saying there was only 3.7GB there despite me seeing the whole thing being over 50GB on the server
I’m not sure if it got corrupted or maybe I was just reading it wrong but either way I got a steer from Bruno to use something that would give me real time info like JConsole or VisualVM. I went for JConsole as it was already installed.
JConsole
It too was initially a bit tricky to setup as the production server firewall is obviously locked down. I initially tried to get SSH tunnelling working with the following configuration in NiFi bootstrap.conf1 file:
java.arg.16=-Dcom.sun.management.jmxremote.port=8990
java.arg.19=-Dcom.sun.management.jmxremote.ssl=false
and then just point JConsole to localhost:8990 (I was just forwarding the same port). This was working on my local NiFi but for some reason kept timing out on the remote instance. I was completely stumped until I found this SO post which explained that the port I set above is just the registry port and would need to set the server port as well. I tried setting them both to 8990, as explained however this also timed out. I got it working with the SOCKS proxy configuration from the second answer like so:
ssh -D 8990 uname@host
jconsole -J-DsocksProxyHost=localhost -J-DsocksProxyPort=8990 localhost:8990 -J-DsocksNonProxyHosts=
Down to business
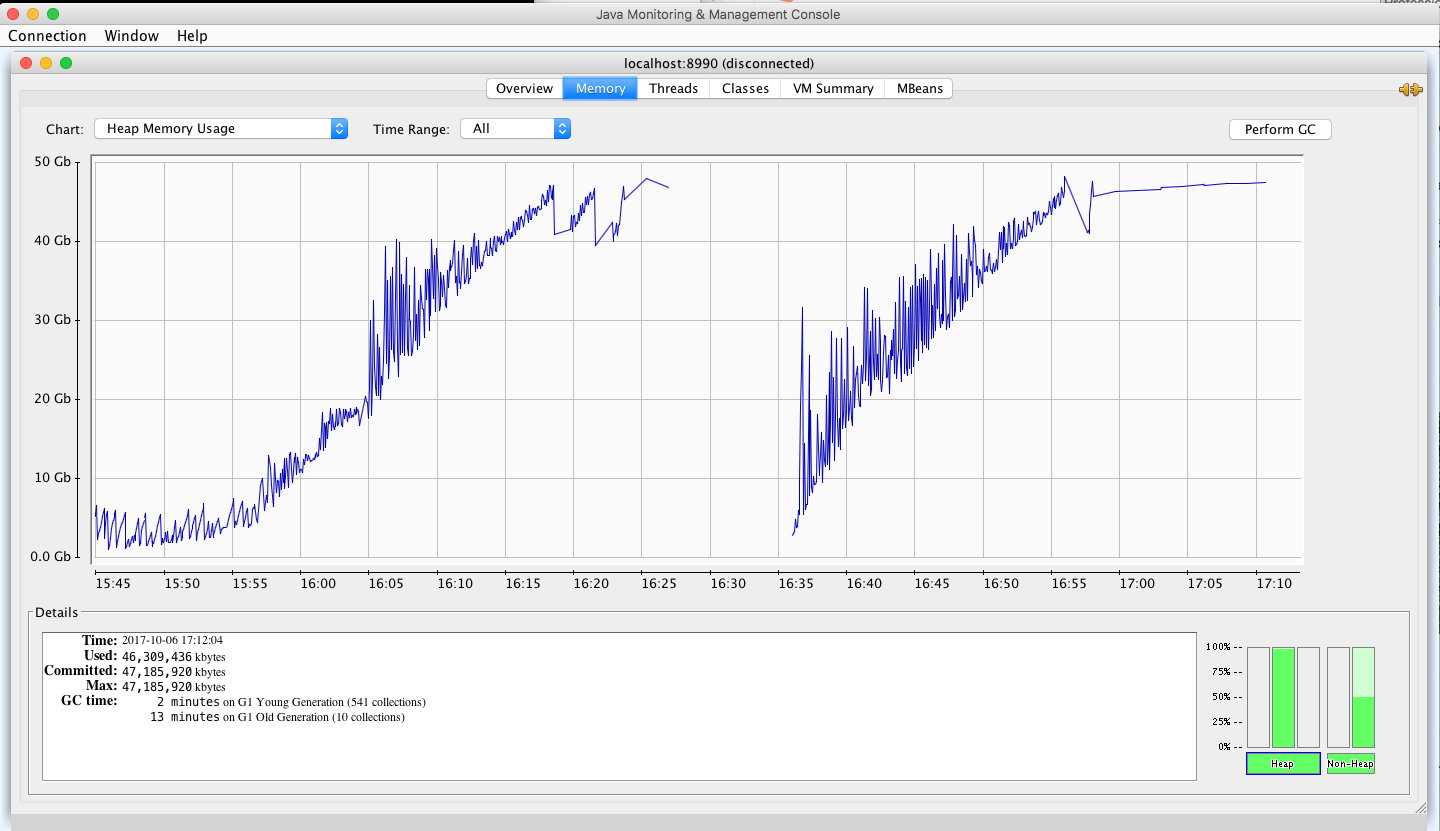
With a decent way to have a look at the internals, I went to work binary searching the flow to see where the issue might be. The JConsole graph below clearly shows the increase after I turned on the offending flow at 15:57 and again after the restart. That flow looked fairly innocuous as it was using all standard NiFi procs except a third party HQL one which I don’t have the code for. I was expecting a memory leak and I had used all those processors before so thought that unlikely. Of course with software you never know so I kept digging. Eventually, I narrowed it down to the ExecuteHQL proc or the SplitAVRO proc immediately following.
Jumping to Conclusions
After looking at what the Hive processor was doing (select id from table), we quickly concluded that that was the issue for two reasons:
- It took 173 seconds just to run a count over the same query:
select count(id) from table - The call returned 18.5 million results every time
So we disabled that proc, patted ourselves on the back and went home victorious.
The rest of the story
I checked again today (Saturday) just to make sure that we had actually found what we were looking for and imagine my surprise to find that it was down again! I stopped the offending processor right? It made sense that that would be where the issue was; there was so much data coming back and taking so long. Clearly that wasn’t the whole story. After some more investigation I narrowed it to the SplitAVRO processor directly after. The ExecuteHQL proc was successfully streaming that result set back and it was only a GB in size, but the SplitAVRO was then trying to split that one file into 18 million flow files each with its own set of attributes. While I’m fairly sure that it is actually that processor, I’m not entirely sure that that is the reason. There is easily enough memory to load the whole file and I’m fairly sure I’ve seen flows with millions of flow files in flight. I will have to dig more into this to understand exactly the mechanism here.
Continual Learning
I leaned a lot from the recent developments including how to get a real-time look at the JVM (apparently VisualVm is even more granular) and some more about streaming arbitrarily large data sets in NiFi. On top of that I dug a bit into possible causes of memory leaks, how to track them down, some of the different types of memory locations such as Young Generation (Eden and Survivor spaces) and Old Generation (Tenured and PermGen), and the basics around the role the garbage collector plays.
-
Ideally, don’t disable SSL. In this instance, the machine was within our networks so the risk is minimal but I will configure if I need to do this again. ↩